1.1 Characteristics Table
Characteristics Table output by the QRP Reporting Tool is highly customizable. Using parameters in Baseline File, users can specify what will be included and the way in which it will be displayed in the final output file.
Characteristics Tables include patient and demographic characteristics, with options to add health characteristics, previous medical product use, laboratory characteristics, and health care and drug utilization information. Means and standard deviations are output for continuous variables while numbers and percentages of episodes are output for categorical variables.
If the Query Request Program contains more than one monitoring period, then there will be one table produced per monitoring period. Additionally, users can specify whether to stratify characteristics tables by data partner using Create Report File.
When Characteristics Tables are stratified by data partner (DP), there is no need for aggregation of descriptive statistics. However, when multiple data sources are aggregated into one Characteristics Table, aggregated descriptive statistics are calculated as described below.
1.1.1 Calculation of Unweighted Aggregated Descriptive Statistics
Suppose there are two groups, t and c, and k = 1, 2, …, K DPs. Then, we let nt, k denote the DP-specific sample size for group t, x̄t, k denote the DP-specific means for group t, st, k denote the DP-specific standard deviations for group t, p̂t, k = x̄t, and k denote the proportion of the group t with a given characteristic.
The aggregated sample mean, \({\bar{x}}_t\), is calculated as:
\[\begin{equation} {\bar{x}}_t=\frac{\sum_{k=1}^{K}{n_{t,k}{\bar{x}}_{t,k}}}{\sum_{k=1}^{K}n_{t,k}} \tag{1.1} \end{equation}\]
The aggregated standard deviation, \(s_t\), is calculated as a weighted average of the DP-specific standard deviations:
\[\begin{equation} s_t=\frac{\sum_{k=1}^{K}{\left(n_{t,k}-1\right)s_{t,k}}}{\sum_{k=1}^{K}n_{t,k}-K} \tag{1.2} \end{equation}\]
The aggregated proportion of patients with a given characteristic, \({\hat{p}}_t\), is calculated as:
\[\begin{equation} {\hat{p}}_t={\bar{x}}_t=\frac{\sum_{k=1}^{K}{n_{t,k}{\hat{p}}_{t,k}}}{\sum_{k=1}^{K}n_{t,k}} \tag{1.3} \end{equation}\]
x̄c, sc, and p̂c will be calculated similarly.
The aggregated standardized difference for continuous variables between groups, \(d_{cont}\), is calculated as the weighted average of DP-specific standardized differences:
\[\begin{equation} d_{cont}=\frac{\sum_{k=1}^{K}\frac{({\bar{x}}_{t,k}-{\bar{x}}_{c,k})}{\sqrt{\frac{s_{t,k}^2+s_{c,k}^2}{2}}}}{\sum_{k=1}^{K}n_{t,k}-K} \tag{1.4} \end{equation}\]
The aggregated standardized difference for categorical variables between groups, \(d_{cat}\), is calculated as the weighted average of DP-specific standardized differences:
\[\begin{equation} d_{cat}=\frac{\sum_{k=1}^{K}\frac{({\hat{p}}_{t,k}-{\hat{p}}_{c,k})}{\sqrt{\frac{{\hat{p}}_{t,k}\left(1-{\hat{p}}_{t,k}\right)+{\hat{p}}_{c,k}\left(1-{\hat{p}}_{c,k}\right)}{2}}}}{\sum_{k=1}^{K}n_{t,k}-K} \tag{1.5} \end{equation}\]
1.1.2 Calculation of Weighted Aggregated Descriptive Statistics
When analyses have weights applied, the weighted aggregated standardized difference is calculated analogously to the unweighted aggregated standardized difference, except that instead of using the DP-specific means, DP-specific weighted means are used, and instead of DP-specific variances, DP-specific weighted variances are used. In addition to the notation used above, let wi denote the weight for each individual observation in i = 1, 2, …, n.
Thus, the weighted means, \({\bar{x}}_t^w\) and \({\bar{x}}_c^w\), are calculated as:
\[\begin{equation} {\bar{x}}_t^w=\frac{\sum_{k=1}^{K}{\left(\sum_{i=1}^{n_{t,k}}w_{i,k}\right){\bar{x}}_{t,k}^w}}{\sum_{k=1}^{K}\left(\sum_{i=1}^{n_{t,k}}w_{i,k}\right)} \tag{1.6} \end{equation}\]
\[\begin{equation} {\bar{x}}_c^w=\frac{\sum_{k=1}^{K}{\left(\sum_{j=1}^{n_{c,k}}w_{j,k}\right){\bar{x}}_{t,k}^w}}{\sum_{k=1}^{K}\left(\sum_{j=1}^{n_{c,k}}w_{j,k}\right)} \tag{1.7} \end{equation}\]
DP-specific weighted variances, \(\left(s_t^w\right)^2\) and \(\left(s_c^w\right)^2\), are calculated as:
\[\begin{equation} \left(s_t^w\right)^2=\frac{\sum_{k=1}^{K}v_k\left(s_{t,k}^w\right)^2}{\sum_{k=1}^{K}v_k}\ where\ \ v_k=\frac{\left(\sum_{i=1}^{n_{t,k}}w_{i,k}\right)^2-\left(\sum_{i=1}^{n_{t,k}}w_{i,k}^2\right)}{\left(\sum_{i=1}^{n_{t,k}}w_{i,k}\right)} \tag{1.8} \end{equation}\]
\[\begin{equation} \left(s_c^w\right)^2=\frac{\sum_{k=1}^{K}u_k\left(s_{c,k}^w\right)^2}{\sum_{k=1}^{K}u_k}\ where\ \ u_k=\frac{\left(\sum_{j=1}^{n_{c,k}}w_{j,k}\right)^2-\left(\sum_{j=1}^{n_{c,k}}w_{j,k}^2\right)}{\left(\sum_{j=1}^{n_{c,k}}w_{j,k}\right)} \tag{1.9} \end{equation}\]
The aggregated weighted standardized difference differs from the unweighted aggregated standardized differences in that site-specific sums of weights and sums of weights squared among treatment and control groups are also required. The aggregated weighted standardized difference for continuous variables is calculated as follows:
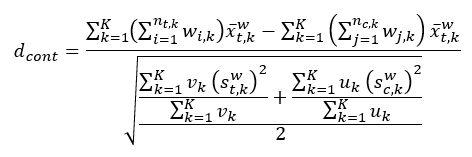
Figure 1.1: Weighted standardized differences of continuous variables.
The aggregated weighted standardized difference for categorical variables between groups is calculated as follows:
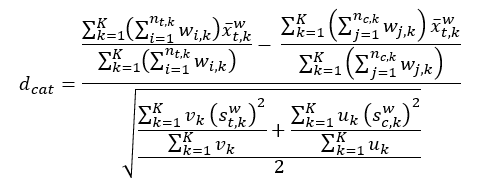
Figure 1.2: Weighted standardized differences of categorical variables.
vk and uk are as defined for DP-specific weighted variances.
1.1.3 Output
Users can specify how many Characteristics Tables to output using Baseline File. By default, all Characteristics Tables are “Table 1”, and increment alphabetically from “a” through “z”.
1.1.3.1 Groups Output
Users are required to specify which cohorts, analytical groups, or mother-infant linkage groups to output in Characteristics Tables by setting the Baseline File GROUP parameter. Groups correspond to columns in Characteristics Tables.
By default, unadjusted tables in Propensity Score (PS) analyses and unweighted tables in Inverse Probability of Treatment Weighting (IPTW) analyses are de-duplicated. In other words, if users specify multiple analytical groups from the same Propensity Score Estimate Group (via qrp.PSEstimationFile), only 1 unadjusted or unweighted table will be output per PS Estimate Group.
In medical product use in pregnancy (Type 4) analyses, users can specify whether the non-pregnant cohort created in QRP should be included in the Characteristics table by setting the appropriate parameter in Baseline File parameter.
In all descriptive analyses except switching analyses, users can also specify that up to two cohorts, analytical groups, or mother-infant linkage groups appear in the same table using Baseline File parameter. By default, only one group will appear in each Characteristics Table, with the exception of Type 6 analyses which will have the initial cohort, patients with a first switch, and patients with a second switch (if applicable) output in separate columns in the same table by default. By specifying to include a second switch group, users can include up to three groups in Type 6 Characteristics Tables (i.e., the initial cohort, the “first switch” group, and the “second switch” group). All inferential analyses will output the exposed and referent analytic groups together by default.
When two groups are included in a single Characteristics Table, users can choose to compare them using absolute and standardized differences. When users request this option in Baseline File, QRP Report will output “Absolute Difference” and “Standardized Difference” columns in Characteristics Tables headed under “Characteristic Balance” in Descriptive (Level 1) analyses and under “Covariate Balance” in Inferential (Level 2) analyses. Groups cannot be compared in Type 6 “Switching” analyses. In inferential analyses, groups are compared by default.
Users can set a standardized difference threshold above which groups are considered to be meaningfully different using the appropriate parameter in Baseline File, and QRP Report will output values above this threshold in blue text.
1.1.3.2 Sections Output
As described above, there are numerous sections output in Characteristics Tables.
By default, the first section in the Characteristics Tables contains “Patient Characteristics.” The first row in this section for patient-level analyses—i.e., analyses that do not allow cohort re-entry—will contain the number of unique patients that were included. Analyses that allow cohort re-entry and are thus constructed on the episode-level will output the number of episodes included in the analysis. Inferential analyses with weights will additionally output the weighted number of patients. In Type 4 analyses, this section is labeled “Mother Characteristics” by default.
The next section output in Characteristics Tables is labeled “Demographic Characteristics” and contains rows describing mean patient age, age distribution based on user-specified categorical age groups, sex, calendar year of exposure, race, and ethnicity groups. Categories and units of demographic characteristics are specified using the appropriate parameters in qrp.CohortFile.
In addition to the default sections, users can specify that Characteristics Tables also include the sections described below. For each section described below, if no values are specified, those sections will not be output.
- Health, Medical Product Use, and Health Service Utilization Characteristics
- The QRP Reporting Tool can output separate sections that contain individual user-specified comorbidities, medical product use, health service utilization metrics, and/or a combined comorbidity score.
- Any of the characteristics mentioned in above can be output in any one of the sections, which are output in the order mentioned previously.
- The combined comorbidity score is calculated based on comorbidities observed during the user-defined window around the exposure episode start date.1,2
- Available health service utilization metrics include: mean number of inpatient stays, institutional stays, emergency department visits, outpatient visits, ambulatory encounters, dispensings, unique generics dispensed, and unique drug classes dispensed.
- Using parameters in Baseline File, users specify which characteristics should be output under each section.
- The section headers are output as “Health Characteristics,” “Medical Product Use,” and “Health Service Utilization Intensity Metrics,” respectively.
- The QRP Reporting Tool can output separate sections that contain individual user-specified comorbidities, medical product use, health service utilization metrics, and/or a combined comorbidity score.
- Sections Unique to Type 4 Analyses
- Pregnancy Characteristics
- Users may specify that certain pregnancy-related characteristics be output in a separate section of Characteristics Tables after the “Demographics Characteristics” section using the Baseline File
PREGNANCYCHARparameter. - Optional rows include:
- Descriptions of the length of pregnancy as a) pre-term (0–258 days), b) term (259–280 days), c) post-term (281–301 days), and d) unknown term
- Mean estimated gestational age at delivery
- Users may specify that certain pregnancy-related characteristics be output in a separate section of Characteristics Tables after the “Demographics Characteristics” section using the Baseline File
- Exposure Characteristics
- Users can choose to output characteristics of the pregnancy-related exposure after the Pregnancy Characteristics section by specifying Baseline File
EXPOSURECHAR. - Exposure characteristics can include:
- Mean gestational age of first exposure in weeks
- Mean number of dispensings in a) user-specified pre-pregnancy period, b) first trimester, c) second trimester, and d) third trimester
- Exposure status during the a) user-specified pre-pregnancy period, b) first trimester, c) second trimester, and d) third trimester
- Users can choose to output characteristics of the pregnancy-related exposure after the Pregnancy Characteristics section by specifying Baseline File
- Infant Characteristics
- Users can choose to additionally include a section headed “Infant Characteristics,” which is output below the last row of “Mother Characteristics.”
- This section includes any user-specified infant characteristics preceded by rows for “Mean enrollment time after birth (days)” and “Mean difference between date of birth and date of enrollment (days).”
- Pregnancy Characteristics
1.1.3.3 Rows Output
Users have three options for specifying the order in which characteristic rows are output in Characteristics Tables. Using the Baseline File COVARSORT parameter, rows within sections can be sorted in:
- Alphabetical order, based on the characteristic’s label
- Numerical order, based on the characteristic’s assignment in
qrp.CovariateCodes - User-specified order, based on the order specified in Baseline File.
In inferential propensity score analyses, users can additionally specify that a footnote be added to characteristics not included in the propensity score logistic regression model using the appropriate parameter in Baseline File parameter.
Users may wish to additionally output a “profile” table that describes the number of patients and episodes that qualify for combinations of characteristics by setting the appropriate parameter in Baseline File.
1.1.3.4 Table Titles
The QRP Reporting Tool outputs default titles for Characteristics Tables based on the analysis Type and whether it is an inferential or descriptive analysis. The default titles use information from QRP to determine the minimum and maximum query period to output, and can be further customized by specifying values for GROUPLABEL and BASELINELINELABEL in the Label File LABELTYPE parameter.
Additionally, the database name in Characteristics Tables will default to “Sentinel Distributed Database” unless otherwise specified in DP Info File. For data partner-specific Characteristics Tables, the word “Aggregated” will be replaced with the masked ID requested in DP Info File.
The last phrase in all Characteristics Table titles will be “from Month Day, Year to Month Day, Year” where the start date is taken from qrp.MonitoringFile and the end date is the maximum date of all the included data partner end dates (unless an explicit follow-up end date is specified in qrp.MonitoringFile and is earlier than the maximum data partner end date, in which case the end date is the follow-up end date).
Table 1.1 describes default titles and placement of user-specified labels for each type of analysis.
| Analysis Type | Inferential? | Default Title | Notes |
|---|---|---|---|
| Background rates | No | Aggregated Characteristics of [Group Label], [Baseline Label], in the [Database] from [Start Date] to [End date] |
|
| Exposures and Follow-Up Time | No | Aggregated Characteristics of [Group Label], [Baseline Label], in the [Database] from [Start Date] to [End date] | |
| Medical Product Utilization | No | Aggregated Characteristics of [Group Label], [Baseline Label], in the [Database] from [Start Date] to [End date] | |
| Medical Product Switching Patterns | No | Aggregated Characteristics of [Group Label], [Baseline Label], in the [Database] from [Start Date] to [End date] | |
| Medical Product Use During Pregnancy | No | Aggregated Characteristics of [Group Label/MIL Group Label], [Baseline Label], in [Database] from [Start Date] to [End date] |
|
| Exposures and Follow-Up Time | Yes | Unadjusted: Unadjusted Aggregated Characteristics of [PS Estimate Group Label] in the [Database] from [Start Date] to [End Date] |
|
| Yes | Adjusted: Adjusted Aggregated Characteristics of [Group Label] (Propensity Score Matched, [Fixed/Variable] Ratio [1:N], Caliper: [value]) in the [Database] from [Start Date] to [End Date] | ||
| Yes | Unweighted: Unweighted Aggregated Characteristics of [Group Label] (Unweighted, Trimmed) in the [Database] from [Start Date] to [End Date] | ||
| Yes |
Weighted:
|
||
| Medical Product Use During Pregnancy | Yes | Unadjusted: Unadjusted Aggregated Characteristics of [PS Estimate Group Label] in the [Database] from [Start Date] to [End Date] | |
| Yes | Adjusted: Adjusted Aggregated Characteristics of [Group Label] (Propensity Score Matched, [Fixed/Variable] Ratio [1:N], Caliper: [value]) in the [Database] from [Start Date] to [End Date] | ||
| Yes | Unweighted: Unweighted Aggregated Characteristics of [Group Label] (Unweighted, Trimmed) in the [Database] from [Start Date] to [End Date] | ||
| Yes |
Weighted:
|
1.1.3.4.1 Customized Value Derivation
- Group Label: value specified in Label File
LABELwhenLABELTYPE = GroupLabel - Baseline Label: value specified in Label File
LABELwhenLABELTYPE = BaselineLabel - Database: value specified in [DPInfo File]
DATABASE - Start Date: value specified in
qrp.MonitoringFile.STARTDATE - End Date: maximum date of all the included data partner end dates (unless
qrp.MonitoringFile.FUPENDDATEis specified and is earlier than the maximum data partner end date, in which case the end date is the follow-up end date) - PS Estimate Group Label: value specified in Label File
LABELwhenLABELTYPE = GroupLabelandGROUPis as specified inqrp.PSEstimationFile.PSESTIMATEGRP - Standard Subgroup Label: value specified in
qrp.PSCSSubgroup.SUBGROUP - Subgroup Category: value specified in
qrp.PSCSSubgroup.SUBGROUPCAT - Fixed/Variable: value specified in
qrp.PSMatchFile.RATIO - Ratio 1:N: value specified in
qrp.PSMatchFile.CEILING - Caliper: value: value specified in
qrp.PSMatchFile.CALIPER - Percentile: value: value specified in
qrp.StratificationFile.PERCENTILES - Weight: weighting scheme: value specified in
qrp.IPTWFile.IPWEIGHT
1.1.3.5 Default Footnotes
The footnotes described in Table 1.2 are output below Characteristics tables as specified by default. If users desire additional footnotes, they will need to be manually entered.
| Placement | Default Use | Footnote |
|---|---|---|
| After “Percent/Standard Deviation” column header(s) | Always | Value represents the standard deviation where no % symbol follows. |
| After “Race categories” header | When race data included | Race data may not be completely populated at all Data Partners; therefore, data about race may be incomplete. |
| After “Unknown” race category label | When race data collapsed | Includes members classified as having an unknown race by the Data Partner and patients in race categories where the total member count is between one and ten. |
| After comorbidity score label | When combined comorbidity scores are output | The Combined Comorbidity Score is calculated based on comorbidities observed during a requester-defined window around the exposure episode start date. (Gagne JJ, Glynn RJ, Avorn J, Levin R, Schneeweiss S. A combined comorbidity score predicted mortality in elderly patients better than existing scores. J Clin Epidemiol. 2011;64(7):749-759. doi:10.1016/j.jclinepi.2010.10.004; Sun JW, Rogers JR, Her Q, et al. Adaptation and Validation of the Combined Comorbidity Score for ICD-10-CM. Med Care. 2017;55(12):1046-1051. doi:10.1097/MLR.0000000000000824) |
| After first switch group label | Medical product switching pattern analyses | Value represents the proportion of episodes with a first switch. |
| After second switch group label | Medical product switching pattern analyses | Value represents the proportion of first switch episodes with a second switch. |
| Within “Mean gestational age at delivery” and “Mean gestational age of first exposure, weeks” covariates | Medical product use during pregnancy analyses |
ICD-9-CM and ICD-10-CM diagnosis codes for weeks gestation or pre-and post-term deliveries that occurred within seven days of an inpatient delivery were used to calculate the length of pregnancy episodes ending in live births as validated in the Medication Exposure in Pregnancy Risk Evaluation Program algorithm. In the absence of relevant codes, pregnancy duration was set to qrp.Type4File.DEFAULTPREGDUR days.
|
| After each specified covariate | Inferential analyses when user-specified in COVNOTINPS found in the QRP Report Baseline File | Covariate not included in the propensity score logistic regression model. |
| After “Patient Characteristics” or “Mother Characteristics” header | Analyses where cohort re-entry is allowed | All metrics are based on the total number of episodes per group except for sex, race, and Hispanic origin, which are based on total number of unique patients. |
| When standardized differences are output | Characteristics in blue font have a between-group standardized difference greater than the value specified for SDTHRESHOLD in the Baseline File. | |
| In inferential propensity score stratum weighting analyses when patients are weighted using an “average treatment effect” weight | This table is meant to facilitate the assessment of covariate balance after inverse probability weighting and should not be interpreted as a description of the unweighted population. Patients were weighted by the proportion of the total patient population included in their propensity score (PS) stratum divided by the proportion of the total treated/comparator patient population included in their PS stratum. | |
| In inferential propensity score stratum weighting analyses when patients are weighted using an “average treatment effect in the treated” weight | This table is meant to facilitate the assessment of covariate balance after inverse probability weighting and should not be interpreted as a description of the unweighted population. Treated patients were assigned a weight of 1, and control patients were weighted by the proportion of the total treated patient population included in their propensity score (PS) stratum divided by the proportion of the total control patient population included in their PS stratum. | |
| In inferential IPTW analyses when patients are weighted using an “average treatment effect” weight | This table is meant to facilitate the assessment of covariate balance after inverse probability weighting and should not be interpreted as a description of the unweighted population. Treated patients were weighted by the inverse of their propensity score (PS), while comparator patients were weighted by the inverse of 1 minus their PS. | |
| In inferential IPTW analyses when patients are weighted using an “average treatment effect with stabilization” weight | This table is meant to facilitate the assessment of covariate balance after inverse probability weighting and should not be interpreted as a description of the unweighted population. Treated patients were weighted by the proportion of treated patients in the trimmed population divided by the inverse of their propensity score (PS). Comparator patients were weighted by 1 minus the proportion of treated patients in the trimmed population divided by 1 minus their PS. | |
| In inferential IPTW analyses when patients are weighted using an “average treatment effect in the treated” weight | This table is meant to facilitate the assessment of covariate balance after inverse probability weighting and should not be interpreted as a description of the unweighted population. Treated patients were assigned a weight of 1. Comparator patients were weighted by their propensity score (PS) divided by 1 minus their PS. | |
| In inferential weighted analyses with variable ratio matching | Each treated patient was matched to a variable number of comparators. Treated patients were assigned a weight of 1. Comparator patients were weighted by the inverse of the matching ratio for that specific matched set. | |
| After “Mother Characteristics” header | Medical product use during pregnancy analyses | Evaluation period is in reference to the user-defined index date (pregnancy start, exposure date, or delivery date). |
| After “Laboratory Characteristics” header | When laboratory results are used as characteristics | Only the laboratory result closest to the index date in the user-defined evaluation window is described. The number of [patients/episodes] with a given categorical result value, or the mean numerical result value among those reported in given unit, is shown indented and italicized below the Romanized number of unique [patients/episodes] with or without a test record. |
1.1.3.6 Missing Data
Missing data will be represented by . in all fields where there are zero patients in the cohort, except patient and episode counts. In DP-specific tables, if the DP does not report race or Hispanic ethnicity data, then all categories for race and Hispanic ethnicity except “Unknown” will be displayed as missing. The “Unknown” category will be displayed as the actual numeric value. In aggregated tables, if at least one DP populates race or Hispanic ethnicity, the actual numeric value will be displayed.
1.1.4 Sample Characteristics Table
Figure 1.3 below is provided as an example of how Characteristics tables are output. No footnotes are included in the sample table for brevity. Not all rows and/or columns presented in the sample table may be output in the final report, based on user-defined specifications discussed above. For example, the “Pregnant patients” row would not be output unless a medical product use during pregnancy analysis is conducted, and a “Weighted patients” row would not be output unless a weighted inferential analysis is conducted.
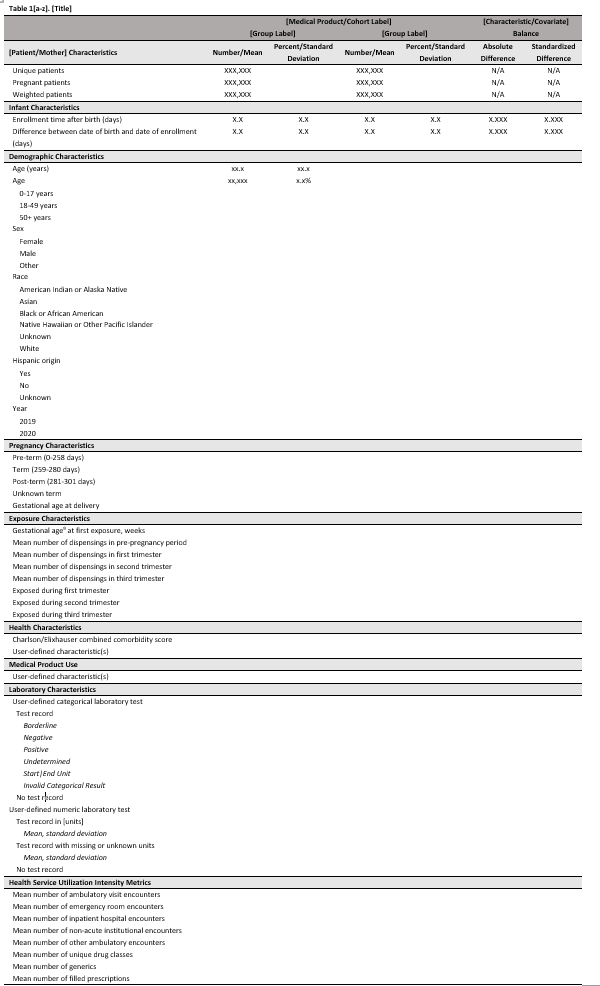
Figure 1.3: Sample Characteristics Table.