5 About the QA Package
This documentation describes QA Package methods and capabilities and provides the information required to get started with running the tool.
5.1 Control Flow Module
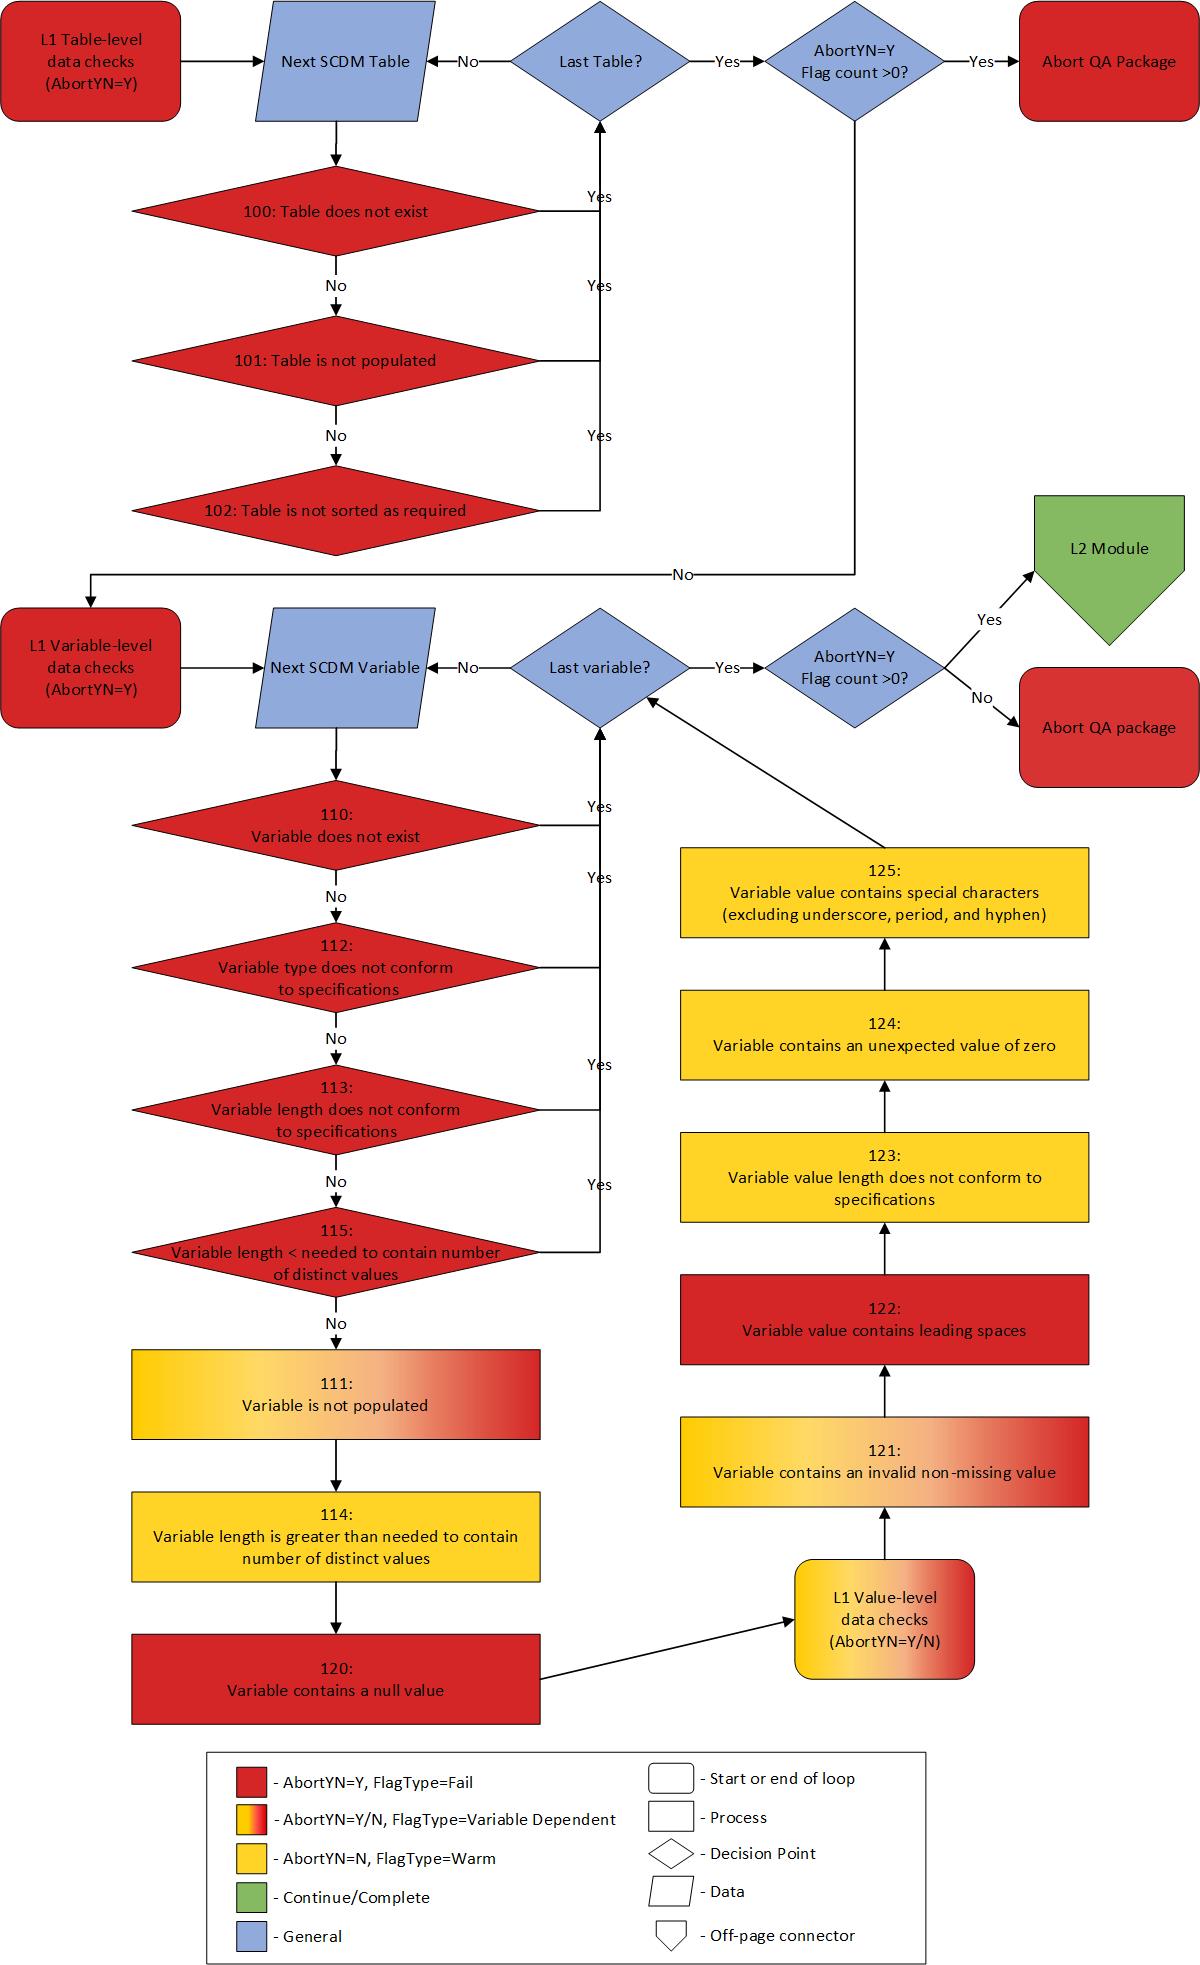
All Level 1 checks for all tables are performed first. If any major issues with the data are detected the package will abort (see Figure 5.1)

Figure 5.1: Control Flow: Level 1 Module Abort Logic
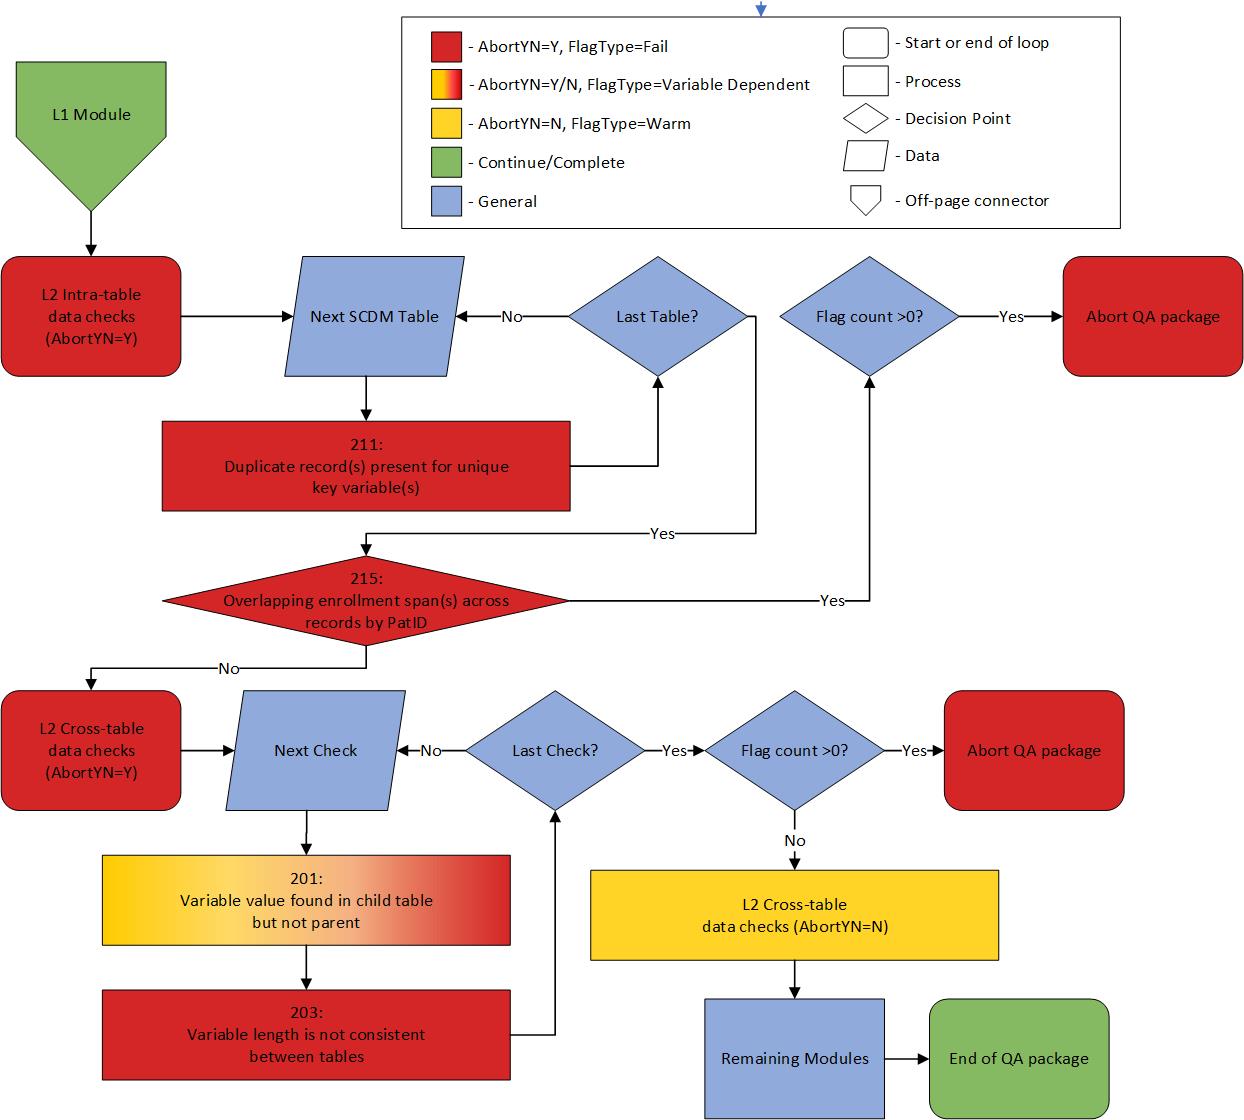
All Level 2 checks are then performed in a logical sequence and abort at each step if AbortYN = Y for any flag in that step (see Figure 5.2). Level 2 checks include:
- Perform critical intra-table checks that would cause downstream data integrity issues
- Perform critical cross-table checks for the same reasoning as above. Note: this is the final place where the package may abort
- Continue to remaining Level 2 checks and all remaining modules, regardless of the resulting data flags. Note: Prior to this step, all resulting datasets are output to the “dplocal” folder. Only log, metadata, and signature files will be in the “msoc” subfolder, until all abort checks have been successfully executed. At that time, all appropriate datasets will be moved to the “msoc” subfolder.

Figure 5.2: Control Flow: Level 2 Module Abort Logic
After successful completion of the Level 2 module, each individual module following will then be executed, in the order specified in the inputfiles/control_flow.csv file.
5.2 Definition Of Enrollment Span Comparisons

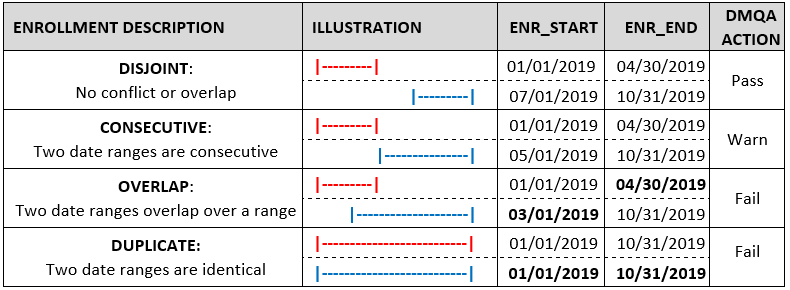
Figure 5.3: Definitions and Examples of Enrollment Date Range Relationships by PatID
5.3 Minimum And Maximum Dates Of Data Completeness
Minimum and Maximum dates of data completeness are created by this package for all SCDM tables4 containing at least one date variable as defined in the input file lkp_all_minmax.sas7bdat.5
Definition 5.1 (Minimum date of data completeness) The Minimum date of data completeness (mindate) is calculated by determining the earliest year-month—e.g., 2010-01—with a record count within an 80% threshold of the record count of the next month—e.g., 2010-02—and then assigning the first day of that month to create a SAS date, formatted as YYYY-MM-DD—e.g., 2010-01-01.
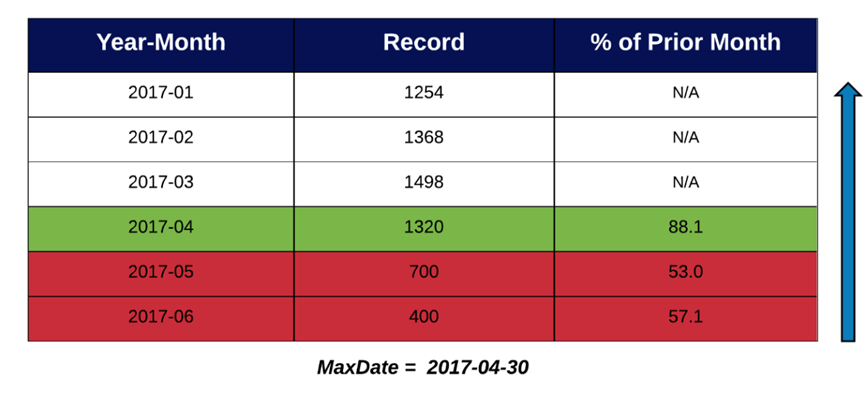
Definition 5.2 (Maximum date of data completeness) The Maximum date of data completeness (maxdate) is calculated by determining the latest year-month—e.g., 2017-10—with a record count within an 80% threshold of the record count of the prior month—e.g., 2017-09—and then assigning the last day of that month to create a SAS date, formatted as YYYY-MM-DD—e.g., 2017-10-31.
Overall minimum are then calculated thus:
Definition 5.3 (Overall Minimum date of data completeness (DP Min)) The overall dp_mindate is calculated by determining the latest mindate—i.e. the maximum of the minimum—from the SCDM Enrollment, Dispensing, Encounter, Diagnosis, and Procedure Table
Definition 5.4 (Overall Maximum date of data completeness (DP Max)) The overall dp_maxdate is calculated by determining the earliest maxdate—i.e. the minimum of the maximum—from the SCDM Enrollment, Dispensing, Encounter, Diagnosis, and Procedure Table
These dates are stored in a SAS dataset minmax_dates. The DPMin and DPMax associated with the latest production ETL at each Data Partner site will be used by Common Components (CC) to populate the global macro variables &mindate and &maxdate for distributed request packages.

Figure 5.4: Example of Maximum date of data completeness algorithm
5.4 Age Calculation
Age in years (age_years) is calculated using the date of birth variable found in the SCDM Demographic Table and the overall maxdate calculated for the ETL under review.
Definition 5.5 (Kreuter method for age calculation) The following equation measures age in whole years. It counts the months between the two dates, subtracts one month if the day boundary has not been crossed for the last month, and then converts months to years and reports it as an integer.4
'Age_years' = floor((intck('month','birth_date',&DP_MaxDate.)-(day(&DP_MaxDate.)\<day('birth_date')))/12)
Age in years is summarized based on the following categories:
00. Missing
00. Negative
01. 0-1 yrs
02. 2-4 yrs
03. 5-9 yrs
04. 10-14 yrs
05. 15-18 yrs
06. 19-21 yrs
07. 22-44 yrs
08. 45-64 yrs
09. 65-74 yrs
10. 75+ yrs
5.5 Enforcing the ICD-10 switchover for Inpatient and Institutional Encounters
The Quality Assurance (QA) Package includes two warn flags, DIA_2_07_00-0_223 and PRO_2_07_00-0_223. These flags are designed to signal when an ICD-10 code is detected prior to October 1, 2015, or when an ICD-9 code is identified on or after this date in either the Diagnosis or Procedure tables.
For the majority of encounter types, the triggering of these flags is dependent on the ADate variable in either the Diagnosis or Procedure table. However, there is an exception for inpatient (IP) and institutional stays (IS). During the transition from the ICD-9 to ICD-10 era, the switchover was based on the discharge date rather than the admission date for these two types of encounters. Consequently, when the EncType is either IP or IS, the QA Package bases this validation check on the Ddate variable from the Encounter Table. The mechanics of the QA Package dictates that these inpatient and institutional stay flags be treated as cross-table checks and are thus implemented as DIA-ENC_2_07_00-0_223 and PRO-ENC_2_07_00-0_223.
References
While the r01_mother_deliveries and / or r02_infants tables, created by the separate Mother-Infant Identification Program contain dates, these are derived dates from the core tables and are thus not used for setting minimum and maximum dates.↩︎
It should be noted that the min/maxdate algorithm may not work well with all types of date distributions—e.g., a distribution with a large drop proceeded or followed by a long, flat tail of many months. When there are at least two consecutive months at the tail end of the distribution with relatively low counts, the algorithm may sometimes pick a month with incomplete data. For example, if the Year-Month
2017-06in Figure 4 had a count of “600” instead of “400”, it would meet the 80% threshold and be incorrectly chosen as the max date.↩︎