1.5 Medical Product Use During Pregnancy and Outcome of Interest Summary Tables
In studies of medical product use during pregnancy, the QRP Reporting Tool outputs tables summarizing pregnancy episodes or medical product use episodes by trimester or gestational week of pregnancy as well as maternal and/or infant’s health outcome of interest of evaluated pregnancy episodes.
When evaluating utilization of medical product related to pregnancy, users have an option to create a 1:1 matched non-pregnant cohort by specifying T4NOPREG or T4NOPREGGESTWK in qrp.Stratafile.TABLEID. The matched non-pregnancy cohort is not available when evaluating maternal and/or infant’s health outcome of interest of evaluated pregnancy episodes. If the user specifies to output that non-pregnant cohort (by specifying T4NOPREG and T4NOPREGGESTWK in the Table File parameter TABLESUBSTRAT), then the QRP Reporting Tool will output said cohort(s) in the summary tables.
When all cohorts include only live-birth outcomes, they will be reported under a “Live Birth Delivery Cohort” header. When all cohorts include only non-live birth outcomes and there are multiple outcomes across cohorts, they will all be reported under a “Non-live Birth Outcome Cohort” header. When all cohorts only include unclassified birth outcomes, they will be output under an “Unclassified Delivery Cohort” header. When all cohorts include only non-live birth outcomes or only mixed birth outcomes, and there is only one outcome defined across all cohorts, they will be output under a header specific to that one outcome (e.g., Trophoblastic Disease Cohort). If none of the preceeding situations is applicable, all pregnancy episodes will be output under a “Pregnant Cohort” header. Non-pregnant cohorts will be reported under a “Matched Non-Pregnant Episodes” header row. In the case when a matched non-pregnant cohort is not requested, it will not be reported.
1.5.2 Medical Product Use during Pregnancy Tables (T1-T6)
In studies of medical product use during pregnancy, users specify a list of medical product of interest (MOI) codes using standardized terminologies like NDC or RxNorm. These MOI codes are used to identify and construct MOI episodes during and around pregnant episodes. In QRP Report, users can summarize the number of pregnancy episodes with evidence of an MOI episode, the number of MOI episodes, and the number of times a medical product code was identified (both before and after adjustment for same-day dispensings). Each of the aforementioned quantities is summarized either by trimester or by gestational week of pregnancy. Summary tables output by trimester and MOI are derived from the QRP t4preg and t4nopreg output datasets, while summary tables output by gestational week and MOI are derived from t4preggestwk and t4nopreggestwk datasets. No further stratification (outside of trimester or gestational week) is available in tables, regardless of user-specified stratification in qrp.UserStrataFile.
Regardless of how users choose to stratify the summary tables or what quantity they choose to summarize, summary tables in studies of medical product use during pregnancy will output the pregnant cohort(s) followed by the matched non-pregnant cohort(s) if applicable. Formatting of header rows before the medical products of interest depends on how the user has chosen to band together cohorts (see User Options). In summary tables stratified by trimester, all header rows for cohorts will include the number of pregnant (or matched non-pregnant) episodes in that particular cohort in parentheses next to the cohort label.
1.5.2.1 Summary Tables by Trimester
For each pregnant cohort in the study, users can summarize four different quantities by MOI and trimester. Table 1.6 below shows the available quantities to summarize and the titles of those tables. These tables can be additionally stratified by variables specified in the Type 4 Level 1 Table File.
Note that table T1 is the only summary table by trimester that outputs percent in addition to count, since percentages are calculated as the proportion of pregnant episodes with evidence of the MOI in the given period out of the total number of pregnant episodes. For stratified tables, this will be out of the total number of pregnant episodes in the strata. Tables T2 through T4 summarize MOI episodes or codes instead of pregnancy episodes, so percentages are not output.
| Table Reference | Summarized Quantity | Table Title |
|---|---|---|
| T1 | Number of pregnancy episodes (or matched non-pregnant episodes) with evidence of any medical product of interest episode | Pregnancy Episodes [and Matched Non-Pregnant Episodes] with [ReportTitle] in the [Database] from [StartDate] to [EndDate], by [Stratifying Variable] |
| T2 | Number of medical product of interest episodes | [ReportTitle] Episodes Among Pregnant [and Matched Non-Pregnant] Cohort(s) in the [Database] from [StartDate] to [EndDate], by [Stratifying Variable] |
| T3 | Number of medical product of interest codes | [ReportTitle] Codes Among Pregnant [and Matched Non-Pregnant] Cohort(s) in the [Database] from [StartDate] to [EndDate], without Adjusting for Same-Day Dispensings, by [Stratifying Variable] |
| T4 | Number of medical product of interest codes, adjusted for same-day dispensings | [ReportTitle] Codes Among Pregnant [and Matched Non-Pregnant] Cohort(s) in the [Database] from [StartDate] to [EndDate], Adjusting for Same-Day Dispensings, by [Stratifying Variable] |
For each quantity, the table includes twelve columns, each defining a different period during or around the pregnancy episode. Table 1.7 in this documentation defines these twelve periods.7
| Column | Meaning |
|---|---|
| [EVIDENCE] in the Pre-Pregnancy Period | Number of [QUANTITY] overlapping the user-specified pre-pregnancy period. Use during the pre-pregnancy period does not constitute use during a trimester of pregnancy. |
| [EVIDENCE] Only During Pre-Pregnancy Period | Number of [QUANTITY] overlapping at least one day in the user-specified pre-pregnancy, but no days in either first, second, or third trimesters. |
| [EVIDENCE] in Any Trimester | Number of [QUANTITY] overlapping any trimester of pregnancy. |
| [EVIDENCE] in the First Trimester | Number of [QUANTITY] overlapping the first trimester of pregnancy, which is defined as the first 97 days after the estimated pregnancy start. |
| [EVIDENCE] in the Second Trimester | Number of [QUANTITY] overlapping the second trimester of pregnancy, which is defined as days 98-185 after the estimated pregnancy start. |
| [EVIDENCE] in the Third Trimester | Number of [QUANTITY] overlapping the second trimester of pregnancy, which is defined as day 186 after the estimated pregnancy start through the pregnancy outcome date. |
| [EVIDENCE] in All Trimesters | Number of [QUANTITY] overlapping at least one day in each trimester of pregnancy. |
| [EVIDENCE] in the Post-Pregnancy Period | Number of [QUANTITY] overlapping the user-specified post-pregnancy period. Use during the post-pregnancy period does not constitute use during a trimester of pregnancy. |
| [EVIDENCE] Only During First Trimester | Number of [QUANTITY] overlapping at least one day in the first trimester of pregnancy, but no days in either the second or third trimesters. |
| [EVIDENCE] Only During Second Trimester | Number of [QUANTITY] overlapping at least one day in the second trimester of pregnancy, but no days in either the first or third trimesters. |
| [EVIDENCE] Only During Third Trimester | Number of [QUANTITY] overlapping at least one day in the third trimester of pregnancy, but no days in either the first or second trimesters. |
| [EVIDENCE] in Only the Post-Pregnancy Period | Number of [QUANTITY] overlapping at least one day in the user-specified post-pregnancy, but no days in either first, second, or third trimesters. |
The footnotes described in Table 1.8 are output to summary table T1 by default. If users desire additional footnotes in summary tables (T1, T2, T3, or T4), they will need to be manually entered.
| Placement | Footnote |
|---|---|
| Next to column headers indicating drug use in third trimester | Assessing medical product use in the third trimester requires a pregnancy to continue to the third trimester. The denominator is the total number of pregnancy episodes that progress to the third trimester. |
| Next to column headers indicating drug use in second trimester | Assessing medical product use in the second trimester requires a pregnancy to continue to the second trimester (i.e. pregnancy was not terminated in the first trimester); the denominator is the total number of pregnancy episodes that progress to the second trimester. |
1.5.2.2 Summary Tables by Gestational Week
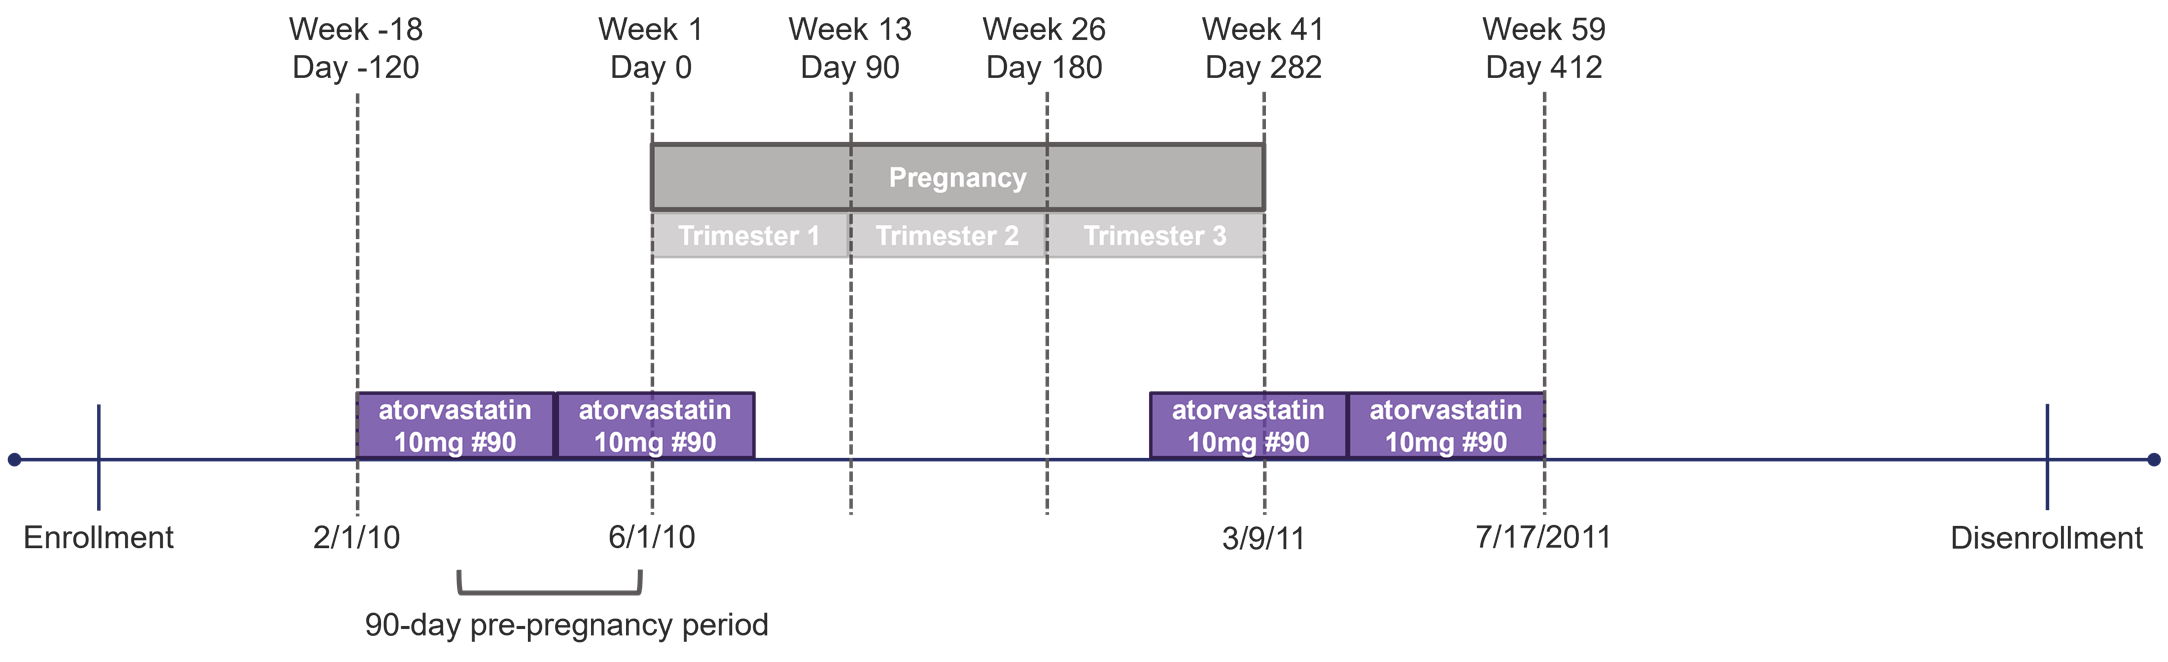
Whereas users can summarize four different quantities in MOI summary tables by trimester, only two quantities can be summarized by gestational week for each pregnant cohort in the study: number of pregnancy episodes with evidence of an MOI episode and number of MOI episodes. Tables summarized by gestational week contain one column for each gestational week during which MOI use is assessed, beginning with the first week and ending with the last week an MOI episode is identified. For instance, consider the example shown in Figure 1.2 below where a user specifies that MOIs should be assessed starting 90 days before pregnancy (Week -12), and the longest pregnancy in the cohort is 282 days (Week 41) in duration. If the earliest MOI episode overlapping an assessed period starts in Week -18 before a pregnancy start and the latest MOI episode overlapping an assessed period ends in Week 59 after a pregnancy start, the summary table by gestational week would start in Week -18 and end in Week 41, since assessment ends at delivery. Users also have the option to request a post-pregnancy evaluation window for MOIs. If requested, MOIs will be summarized by week after pregnancy until the end of the evaluation window.
Each quantity is summarized in its own table, numbered sequentially. Table 1.9 below shows the available quantities to summarize and the titles of those tables. In this table, there will be a footnote indicated after [ReportTitle] in the title that reads “Displayed percentages represent the number of pregnancy (or matched non-pregnant) episodes with evidence of the exposure of interest as a proportion of all pregnancy (or matched non-pregnant) episodes.” When non-pregnant episodes are not displayed in the table, that parenthetical is removed from the footnote. Finally, in the case when [ReportTitle] is not specified in QRP Report Label File parameter LABEL where QRP Report Label File parameter LABELTYPE = ReportTitle, it will default to “Exposure(s) of Interest”.
| Table Reference | Summarized Quantity | Table Title |
|---|---|---|
| T5 | Number of pregnancy episodes (or matched non-pregnant episodes) with evidence of any medical product of interest episode | Pregnancy Episodes [and Matched Non-Pregnant Episodes] with [ReportTitle] in the [Database] from [StartDate] to [EndDate], by Gestational Week |
| T6 | Number of medical product of interest episodes | [ReportTitle] Episodes Among Pregnant [and Matched Non-Pregnant] Cohort(s) in the [Database] from [StartDate] to [EndDate] ,by Gestational Week |
Note that table “T5” is the only summary table by gestational week that outputs percent in addition to count, since percentages are calculated as the proportion of pregnant episodes with evidence of the MOI in the given period out of the total number of pregnant episodes.
1.5.3 Health Outcome of Interest Table (T7)
Users can also summarize maternal and/or infant’s health outcome of interest of evaluated pregnancy episodes and request those outputs from the t4cida dataset: number of patients, number of pregnancy episodes, number of events among pregnancy episodes, time at risk (total days/weeks/years at risk), total observed time, incidence proportion per XX pregnant patients and incidence rate per XX person time at risk.
Users can request stratifications on the following factors: year, age group, race, Hispanic ethnicity, pregnancy outcome, pregnancy outcome category, month, quarter, geographic region variables, user-defined characteristics, gestational age at birth, as well as various combinations of the above factors.
1.5.3.1 Summary Table Describing Outcome of Interest
Among pregnancy episodes that met cohort definition (e.g. the exposed and reference cohort, the exposed cohort only, or the unexposed cohort) and eligible for outcome evaluations, users can summarize occurrence of outcome of interest as a binary outcome for both maternal and infant outcomes and as a time-to-event outcome for maternal outcomes only. When evaluating binary outcome, four columns are produced, including number of pregnant patients, number of pregnancy episodes, number of pregnancy episodes with an event, and number of events per [X] pregnancy episodes. When evaluating time-to-event outcome, in additional to four columns output in binary outcome, there are seven other columns output: total days/weeks/years at risk, event rate per [X] person-days/person-weeks/person-years at risk (95% confidence interval), and total observable time as in Table 1.11.
| Table Reference | Summarized Quantity | Table Title |
|---|---|---|
| T7 | Number of pregnancy episodes with evidence of any health outcome of interest | Summary of Outcomes of Interest Among Pregnancy Episodes with [ReportTitle] in the [Database] from [Startdate] to [Enddate], by [Stratifying Variable] |
The table T7 includes eleven columns which provide outputs related pregnancy episodes and outcome of interest as in Table 1.11 in this documentation.
| Column | Meaning |
|---|---|
| Number of Pregnant Patients | Number of pregnant patients met the cohort defined definition |
| Number of Pregnancy Episodes | Number of pregnant episodes met the cohort defined definition |
| Number of Pregnancy Episodes with an Event | Number of pregnancy episodes met the cohort defined definition and having an outcome of interest |
| Number of Event per [X] Pregnancy Episodes (95% Confidence Interval) | Number of events of interest per [X] pregnancy episodes met the cohort defined definition |
| Total Days at Risk | Total follow-up time in days from the outcome evaluation start to the earliest of outcome evaluation end, event date, end of exposure episode, occurrence of user-defined censoring criteria, if specified (e.g., initiation of the comparator), disenrollment, query period end date and Data Partner end date. |
| Total Weeks at Risk | Total follow-up time in weeks from the outcome evaluation start to the earliest of outcome evaluation end, event date, end of exposure episode, occurrence of user-defined censoring criteria, if specified (e.g., initiation of the comparator), disenrollment, query period end date and Data Partner end date. |
| Total Years at Risk | Total follow-up time in years from the outcome evaluation start to the earliest of outcome evaluation end, event date, end of exposure episode, occurrence of user-defined censoring criteri, if specified (e.g., initiation of the comparator), disenrollment, query period end date and Data Partner end date. |
| Event Rate per [X] Person-Days at Risk (95% Confidence Interval) | Number of events of interest per [X] person-days at risk |
| Event Rate per [X] Person-Weeks at Risk (95% Confidence Interval) | Number of events of interest per [X] person-weeks at risk |
| Event Rate per [X] Person-Years at Risk (95% Confidence Interval) | Number of events of interest per [X] person-years at risk |
| Total Observable Years | Total observable time in years from the users-defined index to the earliest of disenrollment, query end date, and Data Partner end date |
The footnotes described in Table 1.12 are output to the summary tables by default. If users desire additional footnotes, they will need to be manually entered.
| Placement | Footnote |
|---|---|
| At the end of T7 title | Pregnancy is defined as a pregnancy that resulted in livebirths (mother-infant linked or non-linked code-based livebirth) or non-live births identified using the method specified in the overview section of this report. |
| Next to headers with time at risk information (Total Days/Weeks/Years at Risk or Event Rate) | Time at risk (e.g. Total Days at Risk) and related metrics are only available for maternal outcomes if requested (i.e. follow-up time metrics are not computed for outcomes being assessed in infants). |
| At the end of T7 title and when stratification by race is requested | Race data may not be completely populated by all Data Partners; therefore, data about race may be incomplete. |
| After race of “Unknown” | Includes members classified as having an unknown race by Data Partner and patients in race categories where total number of count is between one and ten. |
1.5.4 User Options
Users can leverage qrp_report.TableFile to specify which table(s) to output based on the quantity they are interested in summarizing and whether they’d like the summary output by trimester or gestational week. Users can leverage qrp_report.TableColumnsFile to specify which columns to include in the table(s).
1.5.4.1 Labeling
As in other study designs, users may specify labels for cohorts (both pregnant and non-pregnant) using the Label File parameter LABEL where the Label File parameter LABELTYPE is set to GroupLabel. In the absence of a user-specified cohort label, the QRP Reporting Tool will populate the group name as specified in QRP.
In addition to labeling cohorts, users may also label MOIs using the Label File parameter LABEL where the Label File parameter LABELTYPE is set to MOILabel. When no labels are specified, the QRP Reporting Tool will use the cohort and/or MOI names specified in the QRP.
1.5.4.2 Clustering Together Cohorts and MOIs
Users have the option to cluster together pregnant (or matched non-pregnant) cohorts and/or MOIs. There are 3 levels of clustering that users may choose to implement in a summary table for a study of medical product use during pregnancy:
- User-specified cohorts clustered under a header
- When a study of medical product use in pregnancy has defined multiple pregnant cohorts, the user may choose to cluster those cohorts under a combined header by specifying the appropriate parameter in the Label File.
- MOIs clustered together under an MOI header (Tables T1-T6 only)
- In the case when a user wants to cluster several MOIs under a single header, they may specify which MOIs to group using the Label File parameter LABELVAR and set the MOI Header label using Label File parameter LABEL where LABELTYPE =
MOIHEADER
- In the case when a user wants to cluster several MOIs under a single header, they may specify which MOIs to group using the Label File parameter LABELVAR and set the MOI Header label using Label File parameter LABEL where LABELTYPE =
Figure 1.3 below shows an example of a summary table by trimester where the user has implemented all levels of clustering, whereas Figure 1.4 shows an example of a summary table by gestational week in a study where there is no matched non-pregnant cohort and the user hasn’t clustered any cohorts or MOIs. Figure 1.5 shows an example of an HOI summary table with cohorts clustered under a header.
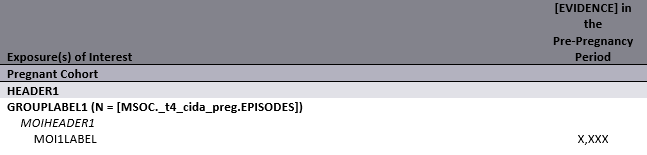
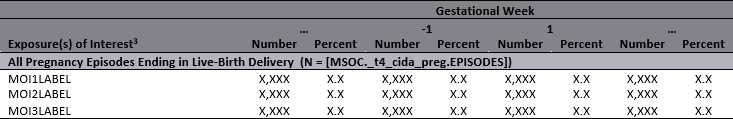
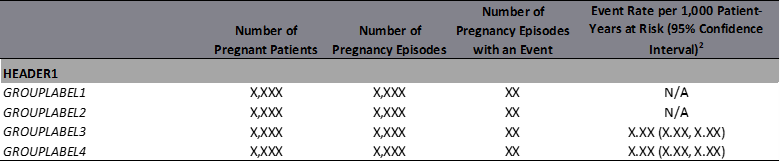
Figure 1.5: Example: HOI Summary Table Clustered by Header
1.5.5 Calculations
Counts of pregnancy (or matched non-pregnant) and MOI episodes are taken from the distributed QRP output in msoc.[RUNID]_t4_cida_preg (or correspondingly from msoc.[RUNID]_t4_cida_nopreg) to populate summary tables by trimester and from msoc.[RUNID]_t4_cida_preg_gestwk (or correspondingly from msoc.[RUNID]_t4_cida_nopreg_gestwk) for summary tables by gestational week. A gestational week is calculated relative to the pregnancy start where Week 0 represents Days 0-6 and Week -1 represents Days -7 to -1. For post pregnancy, gestational week is calculated relative to pregnancy outcome where Week +1 represents days 1 to 7 post pregnancy outcome.
In Tables T1 and T5 where percentages are shown, the denominator is the number of pregnancy episodes lasting to that period. In the case of table T1, the percentage corresponds to the number of pregnancy episodes with MOI use at least one day in the given period divided by the total number of pregnancy episodes. For percentage of MOI use estimated in the third trimester, the denominator is the total number of pregnancy episodes lasting at least one day into the third trimester. The table includes the following footnote to clarify the denominator used: “Assessing medical product use in the third trimester requires a pregnancy to continue to the third trimester (i.e., not end in the first or second trimester); The denominator is the total number of pregnancy episodes that progress to the third trimester.” Similarly for MOI use in second trimester, the denominator is the total number of pregnancy episodes with at least one day in the second trimester, which is clarified with the following footnote: “Assessing medical product use in the second trimester requires a pregnancy to continue to the second trimester (i.e. pregnancy was not terminated in the first trimester); the denominator is the total number of pregnancy episodes that progress to the second trimester.”
In the case of table T5, the percentage corresponds to the number of pregnancy episodes with MOI use at least on day in the given gestational week divided by the total number of pregnancy episodes with at least one day in that gestational week.
[QUANTITY] is a user-specified quantity among: 1. Number of pregnancy episodes (or matched non-pregnant episodes) with evidence of any medical product of interest episode; 2. Number of medical product of interest episodes; 3. Number of medical product of interest codes; or 4. Number of medical product of interest codes, after bridging gaps and adjusting dates for Same-Day Dispensings.
[EVIDENCE] changes based on [QUANTITY]. When [QUANTITY] = 1, [EVIDENCE] = “Use”; when [QUANTITY] = 2, [EVIDENCE] = “Exposure Episodes”; and when [QUANTITY] = 3 or 4, [EVIDENCE] = “Codes”.
Users may specify whether evidence of medical products on the delivery date should constitute an exposure in
qrp.Type4File.REMOVEMOIADATE.↩︎