1.15 Appendices
The QRP Reporting Tool produces appendices both by default and as requested by the user. In addition to providing details on the data sources included in the report, various appendices are also produced to describe methodology and compile cohort, characteristic, and inclusion/exclusion codes.
1.15.1 Default Appendices
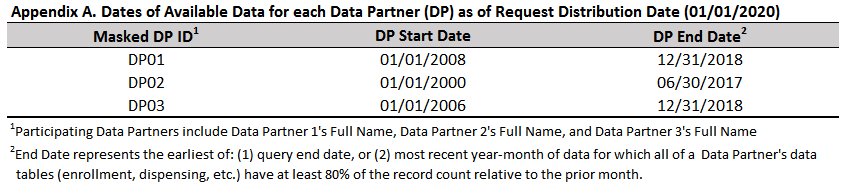
All reports generated using the QRP Reporting Tool will contain Appendix A, “Dates of Available Data for each Data Partner (DP) as of Request Distribution Date.” This appendix contains rows for each DP whose data was included in the report, listed by a masked identifier (specified in the QRP Report DP Info File), detailing the start and end dates for that data. The end date represents the earlier of: (1) query end date, or (2) most recent year-month of data for which all of a Data Partner’s data tables (enrollment, dispensing, etc.) have at least 80% of the record count relative to the prior month. The DPs full names are detailed in a footnote to Appendix A using user-defined values as specified in the QRP Report DP Info File, though in a different order than displayed in the table to preserve site confidentiality. If the user populates the request distribution date in the QRP Report Create Report File, it will be added in parentheses to the end of Appendix A’s title.
The remaining default appendices are output based on the underlying type of analysis performed by the QRP. When a descriptive background rate or cohort study is performed and geographic stratifications are requested, Appendix B details geographic region categories. Because the QRP can output geographic region by either U.S. Census Bureau Region or U.S. Department of Health and Human Services Region, the QRP Reporting Tool will output an appendix describing the states and territories included in each region used in the study. If both classifications are used in the study, the QRP Reporting tool will output Appendix B titled “List of States and Territories Included in Each Census Bureau Region”, as well as Appendix C titled “List of States and Territories Included in Each Health and Human Services (HHS) Region.”
When a medical product switching analysis is performed, the second default appendix contains the computed marketing start date for each cohort at each data partner (not yet functional).
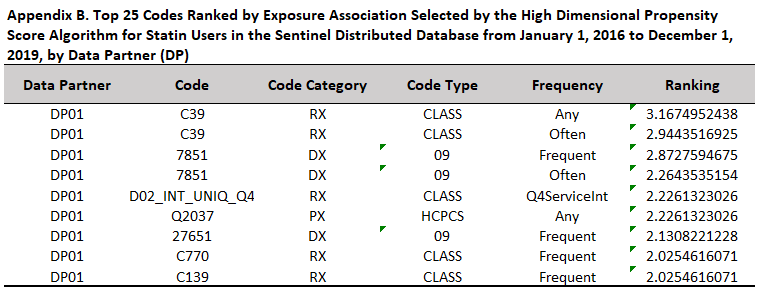
When an inferential high dimensional propensity score (hdPS) analysis is performed, the second group of default appendices describe the top codes ranked by the user-defined ranking variable for each data partner, titled “Top [NUMBER] Codes Ranked by [RANKING VARIABLE] Selected by the High Dimensional Propensity Score Algorithm for [PS ESTIMATE GROUP LABEL] in the [DATABASE] from [START DATE] to [END DATE], by Data Partner (DP)”. For subgroup analyses, the title will be “Top [NUMBER] Codes Ranked by [RANKING VARIABLE] Selected by the High Dimensional Propensity Score Algorithm, for [ANALYSISGRP LABEL], in the [DATABASE] from [START DATE] to [END DATE], by Data Partner (DP), [SUBGROUP: SUBGROUPCAT]”. One appendix is created for each analysis group, each subgroup (where applicable), and each monitoring period. Users can specify how many of the top codes to report using the QRP Report L2 Comparison File, whereas the ranking variable is defined in qrp.PSEstimationFile. For each of the top codes, this appendix reports a masked code, the code category, and the code type, in addition to the frequency with which the code appeared that was chosen for the model, and the ranking.
Code categories mimic those in QRP code input files. Because the QRP also calculates health service intensity indicators and considers them for inclusion in the propensity score model, these will also be reported as codes in this appendix if they end up in the model and are among the top codes. The code category will correspond to the relevant health service. Of note, when the code category is a prescription drug (i.e., RX), the code type is always “CLASS,” and the code itself is a masked value representing that medication’s therapeutic class.
The code frequency column describes which prevalence indicator was considered for inclusion in the hdPS model from the QRP. Before variables are considered for inclusion in the hdPS model as part of the QRP, their prevalence is first calculated and each patient is classified according to the number of times that particular variable appears in their record. Code frequency is described as “any” when the code appears in the hdPS evaluation window at least once. Codes appearing as or more often than the median number of appearances across all patients in the dataset are described as “often,” and codes appearing as or more often than the 75th percentile of the distribution of occurrences are described as “frequent.” The QRP then considers whether having the code appear with an “any,” “often,” or “frequent” frequency is highly associated with the exposure only, outcome only, or exposure and outcome (as specified by the user in qrp.PSEstimationFile). A user-specified number of the top ranked codes are included in the hdPS model, and the frequency indicator that was chosen for inclusion in the model is reported in the variable information appendix in the “Frequency” column.
Because the QRP also calculates health service utilization intensity indicators, these may also appear in the variable information appendix. The frequency with which health services are utilized by patients is not classified into “any,” “often,” and “frequent,” but rather into four quartiles: ≤ 25th, >25th but ≤50th, >50th but ≤75th, and >75th. Thus, if a health service utilization intensity quartile indicator is chosen for inclusion in the hdPS model based on its ranking, its frequency will be described according to quartiles.
To provide more clarity on how health service utilization intensity indicators are reported in “Top N” appendices, consider the following example with “unique number of drug classes” as the health service of interest. The QRP begins its process for selecting variables into the hdPS model by calculating the distribution of “unique number of drug classes” across the data. Then, it creates four indicators for each health service utilization based on the calculated distribution. Each patient will have one of these indicators turned on for each health service utilization metric, based on the number of times that health service appears in their record. For instance, if the median (IQR) number of unique drug classes per patient across the data was 3 (1-7) and a particular patient was dispensed 9 unique drug classes in the hdPS evaluation window, the indicator “D02_INT_UNIQ_Q4” would be turned on because their utilization was above or at the 75th percentile. Continuing this same example, if it turned out that having been dispensed a unique number of drug classes at or above the 75th percentile was highly ranked according to the user-defined ranking variable, the D02_INT_UNIQ_Q4 indicator would be included in the hdPS model. In the variable information appendix, it would appear with a “Q4ServiceInt” frequency.
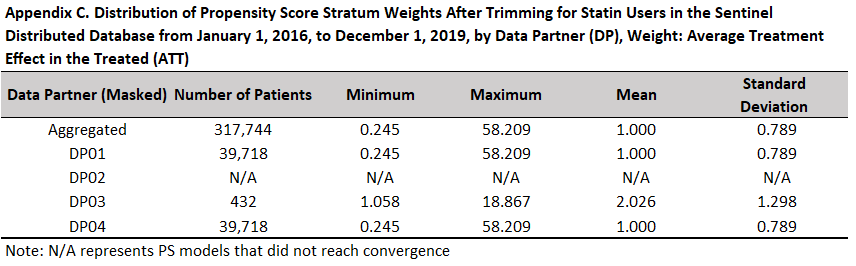
When an inferential propensity score weighted analysis is performed, an appendix describing the distribution of propensity score weights is produced. If high dimensional propensity scores are used, this appendix follows the variable ranking appendix described above. This appendix contains summary statistics for the propensity scores at each data partner and overall. If the propensity score model did not converge at a given data partner, statistics are reported as “N/A.” The title for this appendix uses input from QRP Report Label File and qrp.IPTWFile or qrp.StratificationFile as appropriate to output “Distribution of [PROPENSITY SCORE STRATUM /INVERSE PROBABILITY OF TREATMENT] Weights After Trimming for [PS ESTIMATE GROUP LABEL] in the [DATABASE] from [START DATE] to [END DATE], by Data Partner (DP), Weight: [WEIGHTING STRATEGY].” For subgroup analyses, the title will be “Distribution of [PROPENSITY SCORE STRATUM /INVERSE PROBABILITY OF TREATMENT] Weights After Trimming for [ANALYSIS GROUP LABEL] by Data Partner (DP), [SUBGROUP], Weight: [WEIGHTING STRATEGY].”
1.15.2 Optional Code List Appendices
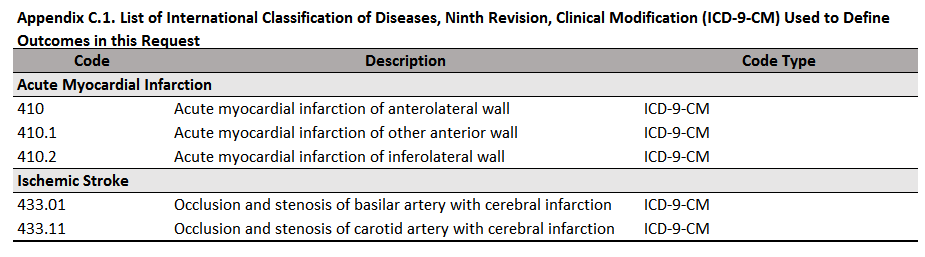
In addition to the default appendices, users can request that the QRP Reporting Tool output appendices detailing code lists used in the study by specifying parameters in QRP Report Appendix File. These appendices will be output in the order specified after any relevant default appendices. This input file references user-supplied external code lists to populate the appendices. There are 7 “appendix types” available for output, defined based on the way in which the codes are used in the study: index-defining, exposure incidence-defining, censor-defining, outcome-defining, outcome incidence-defining, inclusion-defining, and covariate-defining. Within each appendix, users can group codes together under separate headers and specify the order in which each code group appears in that appendix.
If multiple code types were used in the same way for the study, the user should specify unique order values for each code type within a single appendix type in order to output the different code types in different appendices. As an example, if both diagnosis (ICD-10-CM) and prescription (NDC) codes were used to define a covariate—i.e., CODETYPE = DX and RX—the user would want more than one appendix to describe covariate codes. To do so, the user should reference the diagnosis code tab from their code spreadsheet in one row of QRP Report Appendix File with ORDER = X and APPENDIXTYPE = covariate, then use another row to reference the prescription code tab from their code spreadsheet with ORDER = Y and APPENDIXTYPE = covariate. This would result in the different code types appearing in two separate appendices, titled “List of International Classification of Diseases, Tenth Revision, Clinical Modification (ICD-10-CM) Used to Define Covariates in this Request” and “List of National Drug Codes (NDCs) Used to Define Covariates in this Request.”
Appendices are titled using the form “List of [TYPE OF CODE] Used to Define [RELEVANT STUDY PARAMETER] in this Request.” The label for [TYPE OF CODE] is determined based on the code category and code type specified in the code list referenced by QRP Report Appendix File. See Table 1.25 below for labels used in code list appendices.
| Code Category | Code Type | Label for Appendix Title |
|---|---|---|
| DX | 09 | International Classification of Diseases, Ninth Revision, Clinical Modification (ICD-9-CM) |
| 10 | International Classification of Diseases, Tenth Revision, Clinical Modification (ICD-10-CM) | |
| PX | 09 | International Classification of Diseases, Ninth Revision, Clinical Modification (ICD-9-CM) |
| 10 | International Classification of Diseases, Tenth Revision, Procedural Coding System (ICD-10-PCS) | |
| C4 | Current Procedural Terminology, Fourth Edition (CPT-4) | |
| HC | Healthcare Common Procedure Coding System, Level II (HCPCS) | |
| H3 | Healthcare Common Procedure Coding System, Level III (HCPCS) | |
| C2 | Current Procedural Terminology, Second Edition (CPT-2) | |
| C3 | Current Procedural Terminology, Third Edition (CPT-3) | |
| ND | National Drug Codes (NDC) | |
| RE | Revenue (RE) | |
| RX | 09 | National Drug Code (NDC) |
| 11 | National Drug Code (NDC) |
Users should note that any columns included in the code file referenced in QRP Report Appendix File will be output by the QRP Reporting Tool. Code lists including National Drug Codes (NDCs) must include at a minimum the NDC and generic name (which will be output in separate appendices), while code lists including procedure and/or diagnosis codes must include at a minimum the code, code category, code type, and a description. An example code list appendix is provided below in Figure 1.15 for reference.